| Metabolite | Mean SD |
|---|---|
| CDCl3 (solvent) | 180 (67) |
| Cholesterol | 18.6 (11.4) |
| FA -CH2CH2COO- | 33.6 (7.8) |
| Lipid -CH2- | 536.6 (61.9) |
| Lipid CH3- 1 | 98.3 (73.8) |
| Lipid CH3- 2 | 168.2 (29.2) |
| MUFA+PUFA | 32.9 (16.1) |
| PUFA | 30 (24.1) |
| Phosphatidycholine | 31.7 (20.5) |
| Phosphatidylethanolamine | 10 (7.6) |
| Phospholipids | 2.7 (2.6) |
| TMS (interntal standard) | 123 (130.4) |
Lipidomics analysis
Daniel Ibsen 
Basic statistics
Creating figure of metabolite levels
`stat_bin()` using `bins = 30`. Pick better value with `binwidth`.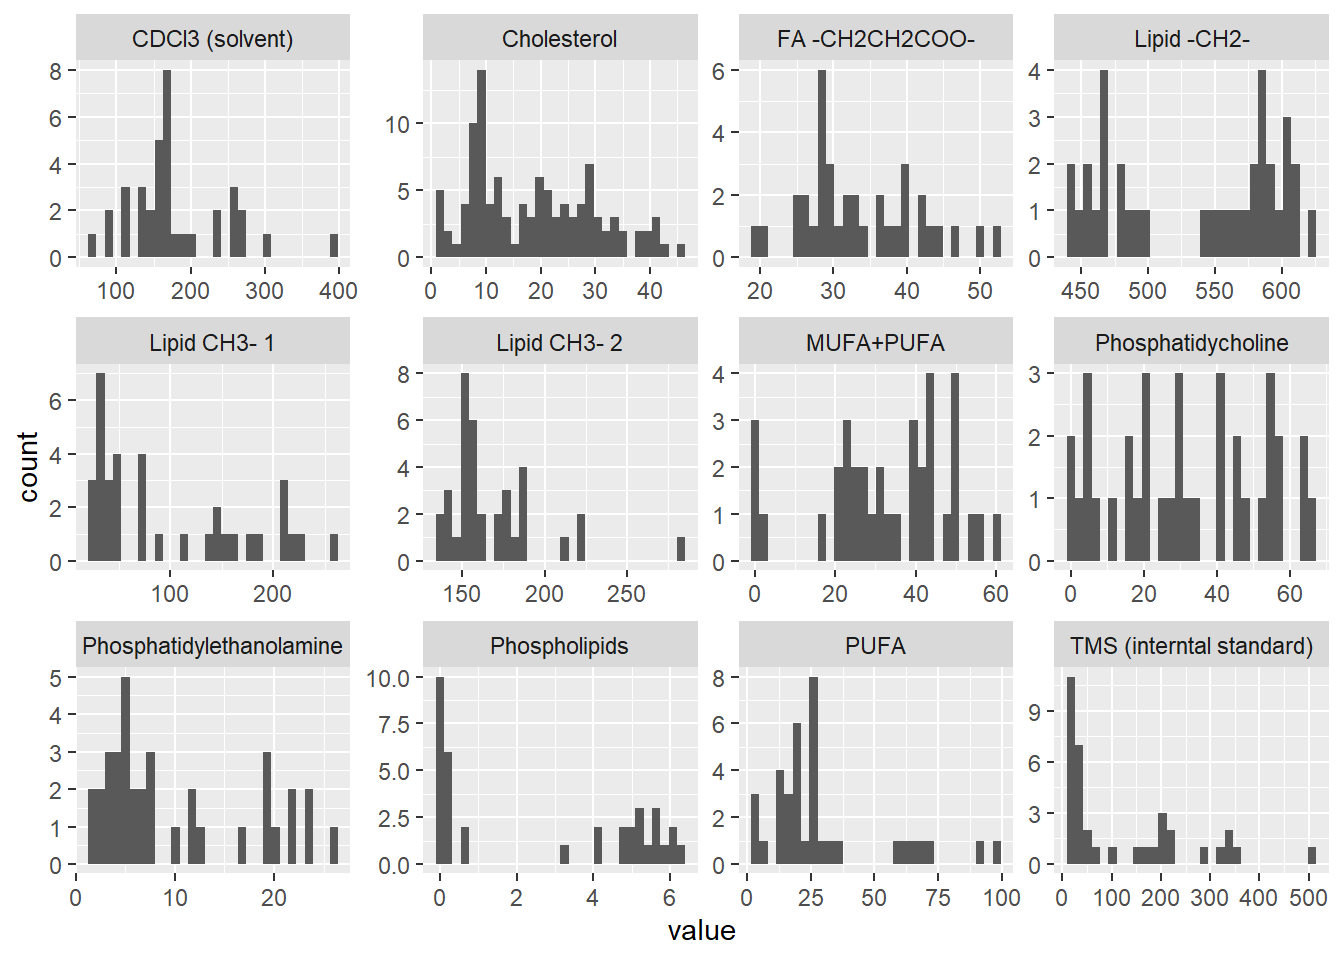
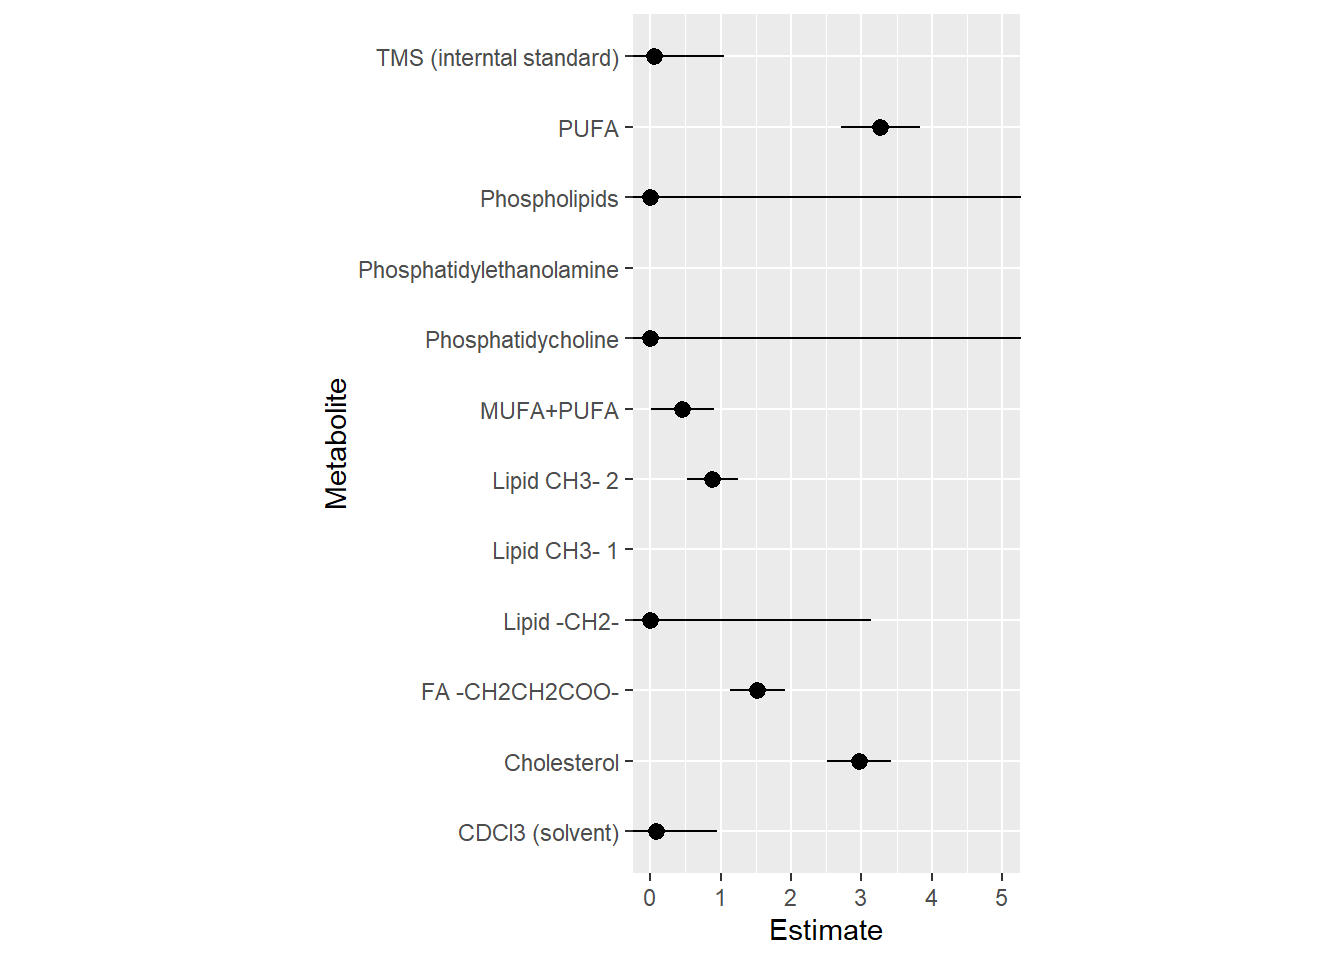
Table of model estimates
| Metabolite | Estimate | Standard error | p-value |
|---|---|---|---|
| TMS (interntal standard) | 0.056 | 0.990 | 0.004 |
| Cholesterol | 2.968 | 0.458 | 0.017 |
| Lipid CH3- 1 | 44.473 | 1.406 | 0.007 |
| Lipid CH3- 2 | 0.885 | 0.361 | 0.734 |
| Lipid -CH2- | 0.003 | 3.139 | 0.058 |
| FA -CH2CH2COO- | 1.524 | 0.387 | 0.276 |
| PUFA | 3.269 | 0.560 | 0.034 |
| Phosphatidylethanolamine | 26.881 | 1.324 | 0.013 |
| Phosphatidycholine | 0.000 | 116628.112 | 0.998 |
| Phospholipids | 0.000 | 68964.221 | 1.000 |
| MUFA+PUFA | 0.456 | 0.449 | 0.080 |
| CDCl3 (solvent) | 0.087 | 0.865 | 0.005 |
Figure of model estimates